A rising market. An asset that outran it.
Philadelphia RevPAR is climbing at about twice the national pace, but the growth is uneven. The hotel Newport operates in the market's softest submarket pulled far ahead of its comp set.
01 The Situation
Philadelphia is gaining RevPAR, but not every hotel is gaining with it.
Philadelphia is a deep market, 52,905 rooms across 485 hotels in seven submarkets, and it is growing faster than the country overall. RevPAR over the trailing twelve months is up 8.1% to $106, about twice the U.S. pace of 4.0%, on occupancy of 65.9% and ADR of $161. September was stronger still, with RevPAR up 15.1%. Supply is tight: inventory is down 0.7% over the year, with only 328 rooms under construction against a ten-year average of 1,000.
But the growth is uneven. Group RevPAR is down 6% and business transient has been slow to return, while leisure carries the market, weekend rates up 4.7% and weekend occupancy up 2.3%. And it varies sharply by submarket. The West Suburbs holds the lowest occupancy of the seven and the steepest occupancy decline. The owners outperforming in a rising market are not riding the tide. They read the submarket and capture the share others leave on the table.
| Philadelphia Submarket | REVPAR | YOY | OCC |
|---|---|---|---|
| Full Philadelphia market | $106 | +8.1% | 65.9% |
| Philadelphia CBD | $157 | +10.1% | 67.6% |
| Central / Northern Bucks | $101 | +4.2% | 68.1% |
| Airport / Stadium | $98 | +6.1% | 68.0% |
| King of Prussia / Valley Forge | $92 | +9.1% | 64.5% |
| West Suburbs | $84 | +4.8% | 59.1% |
| Northeast / Lower Bucks | $80 | +8.3% | 68.7% |
| South Jersey | $75 | +6.6% | 66.4% |
02 The Proof
The market rose. The asset rose faster.
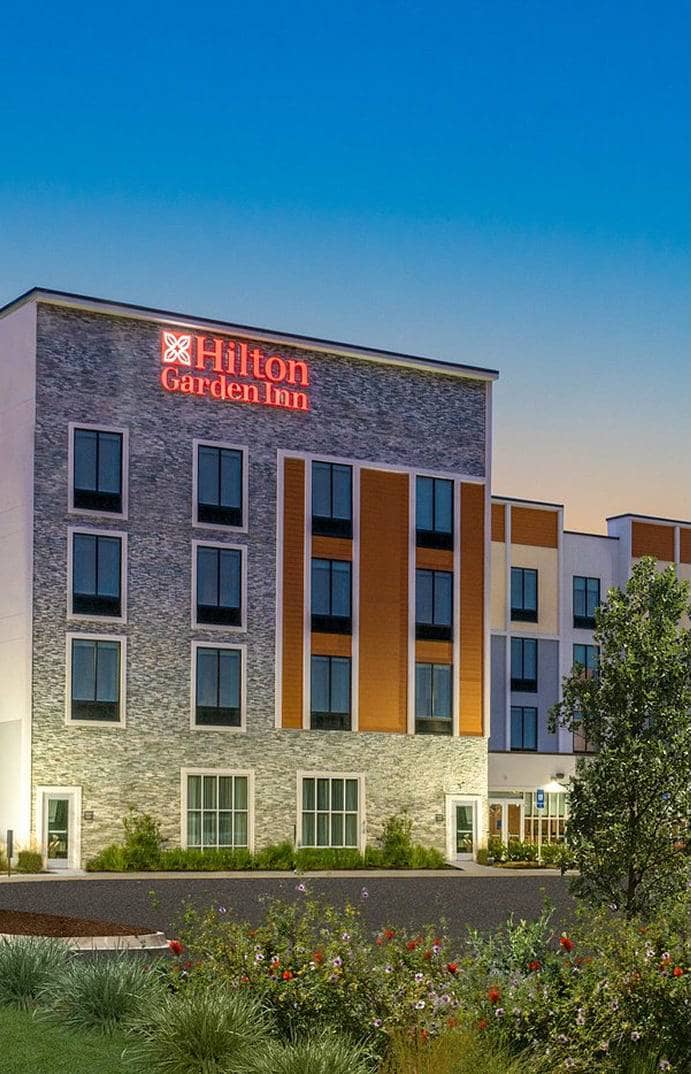
Philadelphia is up 8.1%, while the comp set is barely moving. Just one Newport-operated asset, a select-service hotel in the market's weakest submarket, is capturing far more: a RevPAR index of 135.7 over the trailing twelve months and 138.0 in September, with RevPAR up 10.3% against the comp set's 1.1%.
- 135.7 RevPAR Index Newport asset vs comp set, trailing twelve months
- +10.3% Newport's RevPAR Growth Trailing twelve months
- +1.1% Comp-Set RevPAR Same period
The gap is not the submarket. It is how the asset is run. It pushed rate and grew occupancy at the same time, ADR up 7.1% against 3.6% for the comp set, while its occupancy rose 3.1% in a submarket where occupancy fell 2.2%. And it is not just that one asset: all four hotels Newport operates across Philadelphia ran above fair share in September, with RevPAR indexes from 110 to 138.
Source: Monthly STR, September 2026. Property indexed to its competitive set at 100, with the subject property excluded from comp-set data.

03 The Approach
One commercial strategy, pointed at your submarket.
Newport runs a dedicated Commercial Strategy function across 36 hotels, 3,766 keys, and 11 brands. Revenue management, corporate sales, and digital marketing work off one plan, focused on the individual asset rather than admired from a distance. Here is where it lands on a Philadelphia P&L.
-
Revenue Management
The asset pushed rate and grew occupancy at once. ADR is up 7.1% against 3.6% for the comp set, and its occupancy rose while the comp set's fell, the hardest combination to pull off, in a submarket where occupancy declined 2.2%.
-
Corporate Sales
The opportunity in Philadelphia is a soft weekday and group base, with market group RevPAR down 6%. Our team grew the asset's occupancy 3.1% in that soft submarket, booking business a single property could not reach on its own.
-
Digital Marketing
Leisure is the growing demand, weekend rates up 4.7% and weekend occupancy up 2.3% across the market. Digital marketing captures it on the direct channel, holding the rate rather than renting it back through the OTAs.
-
Scale & Benchmarking
Purchasing at portfolio volume, with flow-through and labor benchmarked against 35 comparable operations, not last year's version of your own hotel.
One system, one outcome.
Commercial strategy opens the gap. Operations and Living Hospitality hold it. This is what it looks like when every part of the management structure points at the same thing, long-term asset value: a hotel that outperforms its market now and stays positioned for what comes next.
Let's talk about your Philadelphia portfolio. One conversation is all it takes.
"*" indicates required fields
Shawn Wallick, Vice President, Chief Development Officer