A softening market. An asset that climbed.
RevPAR is sliding across Charlotte, and every submarket is down. In one of the steepest-declining pockets of the metro, the hotel Newport operates moved the other way.
01 The Situation
Charlotte is giving up RevPAR, submarket by submarket.
Charlotte grew quickly, and supply grew with it, up 4.4%. Demand has since cooled, and RevPAR across the metro is down 5.5% year over year. All ten submarkets are declining.
For an owner who is not in the market every day, that kind of decline is easy to absorb and hard to reverse. The owners still outperforming are not doing it with better amenities or a bigger ad budget. They are doing it with a management team that reads the submarket and moves before the market does.
| Submarket | RevPAR | YoY | Occ |
|---|---|---|---|
| Charlotte CBD | $143.80 | -2.2% | 66.1% |
| Charlotte Douglas Airport | $81.12 | -6.8% | 71.7% |
| Charlotte East / Matthews | $49.79 | -10.3% | 67.3% |
| Charlotte I-77 / SouthPark | $76.35 | -7.2% | 63.5% |
| Charlotte South / I-485 | $90.48 | -2.8% | 65.1% |
| Charlotte University Place | $61.40 | -12.1% | 60.8% |
| Concord / Salisbury | $91.48 | -6.0% | 70.0% |
| Gastonia / Lincolnton | $66.62 | -12.7% | 65.8% |
| Monroe / Rock Hill | $62.81 | -4.9% | 61.4% |
| North Mecklenburg | $67.87 | -8.8% | 63.2% |
02 The Proof
The steepest-declining submarket. The hotel that grew in it.
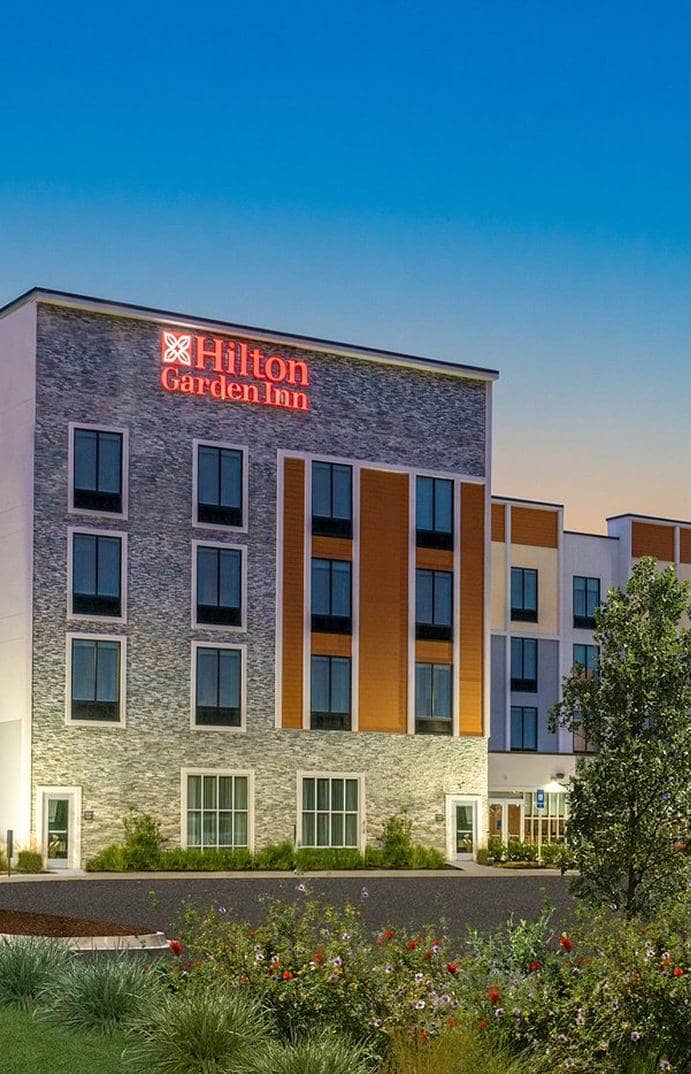
The submarket Newport operates in posted the third-largest RevPAR decline in the metro, down 10.3%. The select-service hotel we run there did the opposite, on both occupancy and RevPAR.
- +2.4% RevPAR Growth Newport asset, YTD 2026
- -5.9% Comp-Set RevPAR Same period
- +12.6% RevPAR Index Gain Trailing 12 months
The spread is not the building. It is what a dedicated commercial strategy function does when it is pointed at one submarket instead of a broad region. Over the trailing year, that asset's occupancy gained 8.7 points while its comp set fell.
Source: Monthly STR, June 2026, six-hotel competitive set, subject property excluded from comp-set data. Property-level figures reported as change only.

03 The Approach
One commercial strategy, pointed at your submarket.
Newport runs a dedicated commercial strategy function across 33 hotels, 3,766 keys, and 11 brands. That scale exists to be spent on the individual asset, not admired from a distance. Here is where it lands on a Charlotte P&L.
-
Revenue Management
Our revenue managers work the submarket, not the region. Through a soft spring in the submarket, that meant holding rate instead of buying occupancy, and moving ADR and occupancy index together rather than trading one against the other.
-
Corporate Sales
We negotiate national and regional accounts across the portfolio and put business in front of a Charlotte asset that it could not win one property at a time.
-
Digital Marketing
We run property-level search, brand.com content, and reputation management, and grow the direct-channel share that keeps an asset off the OTA rate ladder when a comp set starts to discount.
-
Scale & Benchmarking
Purchasing at portfolio volume, and flow-through and labor benchmarked against 35 comparable operations, not last year's version of your own hotel.
One system, one outcome.
Commercial strategy opens the gap. Operations and Living Hospitality hold it. This is what it looks like when every part of the management structure points at the same thing, long-term asset value: a hotel that performs now and stays positioned for what comes next.
Let's talk about your Charlotte portfolio. One conversation is all it takes.
"*" indicates required fields
Shawn Wallick, Vice President, Chief Development Officer